Revision of Design Based Estimates…
Download the revised SCANS-III report on estimates of abundance here: SCANS-III_design-based_estimates_
REVISED REPORT – June 2021:
**The SCANS-III Design Based Estimates report (Hammond et al., 2017) has been revised following the discovery of some analytical errors. The information in the revised report (SCANS-III_design-based_estimates_final_report_revised_June_2021) supersedes the original report and should be used in place of the original. **
************************************************************
The SCANS-III Surveys
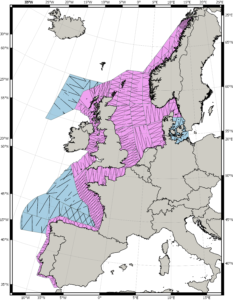
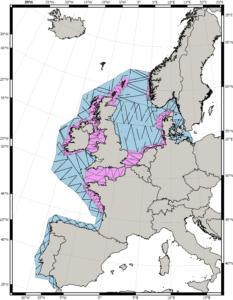
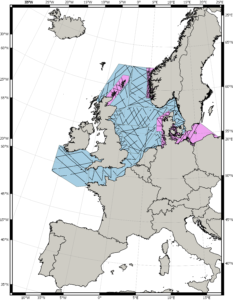
In July and August 2016, three ships and seven aircraft surveyed an area of 1.8 million square kilometres from the strait of Gibraltar in the south to Vestfjorden, Norway in the north over 6 weeks. Teams of observers searched along 60,000 km of transect line, recording thousands of groups of cetaceans from 19 different species. The survey (SCANS-III) is the third in a series that began in 1994 (SCANS) and continued in 2005 (SCANS-II).
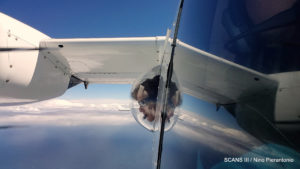
The data were collected using sampling methods designed to allow correction for animals missed on the transect line, without which estimates of abundance would be negatively biased. This was achieved using two semi-independent teams of observers on the ships and using the “circle-back” aerial survey method, in which the aircraft flies a loop to re-survey the same piece of transect.
The new estimates of abundance will be integral to cetacean assessments undertaken for the Convention for the Protection of the Marine Environment of the North-East Atlantic (OSPAR) quality status report and for the EU Marine Strategy Framework Directive assessments of Good Environmental Status.
The results also enable the impact of bycatch and other anthropogenic pressures on cetacean populations to be determined, fulfilling a suite of needs under the EU Habitats Directive and the UNEP Agreement on the Conservation of Small Cetaceans in the Baltic, North east Atlantic, Irish and North Seas (ASCOBANS).
The most abundant species were harbour porpoise (467,000), common dolphins (473,000) and striped dolphins (441,000), with a further 184,000 either common or striped dolphins. Numbers of other species of dolphins estimated to be present were 33,000 bottlenose dolphins, 36,000 white-beaked dolphins and 16,000 white-sided dolphins.
Deep-diving whales that feed primarily on squid in offshore waters were estimated to be 29,000 pilot whales, 17,000 sperm whales and 8,000 beaked whales of several different species. Of the filter-feeding baleen whales, 15,000 minke whales and 27,000 fin whales were estimated to be present.
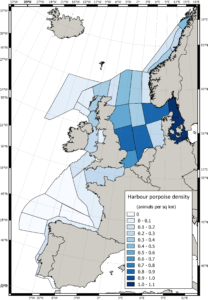
The results indicate that the shift seen in harbour porpoise distribution in the North Sea from the northwest in 1994 to the south in 2005 was maintained in 2016, with the highest densities found in the southwestern North Sea, and north and east of Denmark.
Further updates to follow: Watch out for results of the distribution and habitat use modelling, coming later this summer.
For harbour porpoise, white-beaked dolphin and minke whale in the North Sea, the series of abundance estimates show no evidence of any change over the 22 years covered by the surveys.
For the other species in the region, at least one more survey will be needed in the future before the conservation status can be assessed.
Resources available for download:
SCANS-III revised report on estimates of abundance: SCANS-III_design-based_estimates_final_report_revised_June_2021
Survey block shapefiles: Shapefiles
Coarse scale density maps for harbour porpoise, bottlenose dolphin, white-beaked dolphin, common dolphin, striped dolphin, minke whale, pilot whale and fin whale: Species density maps